
VISUAL PATHWAY AND RETINA
Visual impairments occur in over 60% of patients with psychosis, and pathologies are observed in the visual pathway, from the retina to the thalamus to the visual cortex. We utilize imaging techniques to produce high-resolution images of retinal structure via optical coherence tomography (OCT) and optical coherence tomography angiography (OCT-A). In addition, we can acquire measures of retinal electrical response via electroretinography (ERG) to observe how well retinal cells are functioning. Understanding the changes in retinal structure, vasculature, and function as well as their relationships to structures within the visual pathway and in the cortex can help us to better understand the neurobiological mechanisms of psychosis and provide the basis for novel therapeutics, including non-invasive brain stimulation, photopic stimulation, and/or visual remediation. 
Diagram of the visual pathway (via Miquel Perelló Nieto - Own Work)
The retina and brain share embryological origins; therefore, the retina can be thought of an extension of the central nervous system. Located at the back of the eye, it is the first structure in the visual pathway and is made up of photoreceptors (rods and cones) and neural cells that work together to capture visual information that is sent to the brain. The visual signal is sent from the retina to the brain via the optic nerve, a bundle of fiber made up from the axons of ganglion cells (retinal output neurons). The optic nerve mainly projects to the lateral geniculate nucleus of the thalamus, which sends the visual signal to the primary visual cortex (V1). Here, processing of visual information begins and continues as V1 sends information to higher visual cortices (V2, V5/MT, etc.).
Colored OCT image (via RSIPVision)
Optical coherence tomography (OCT) utilizes light to create high-resolution images of the retina and its layers (image on left). Retinal vasculature can also be visualized through optical coherence tomography angiography (OCT-A, image on right). A plethora of measures can be extracted from these images: layer thickness, capillary blood flow (via Doppler OCT), vessel diameter, vessel density, and capillary complexity. In psychosis, layer atrophy (particularly in the inner retina), increased vein diameter, and decreased artery diameter have been observed. 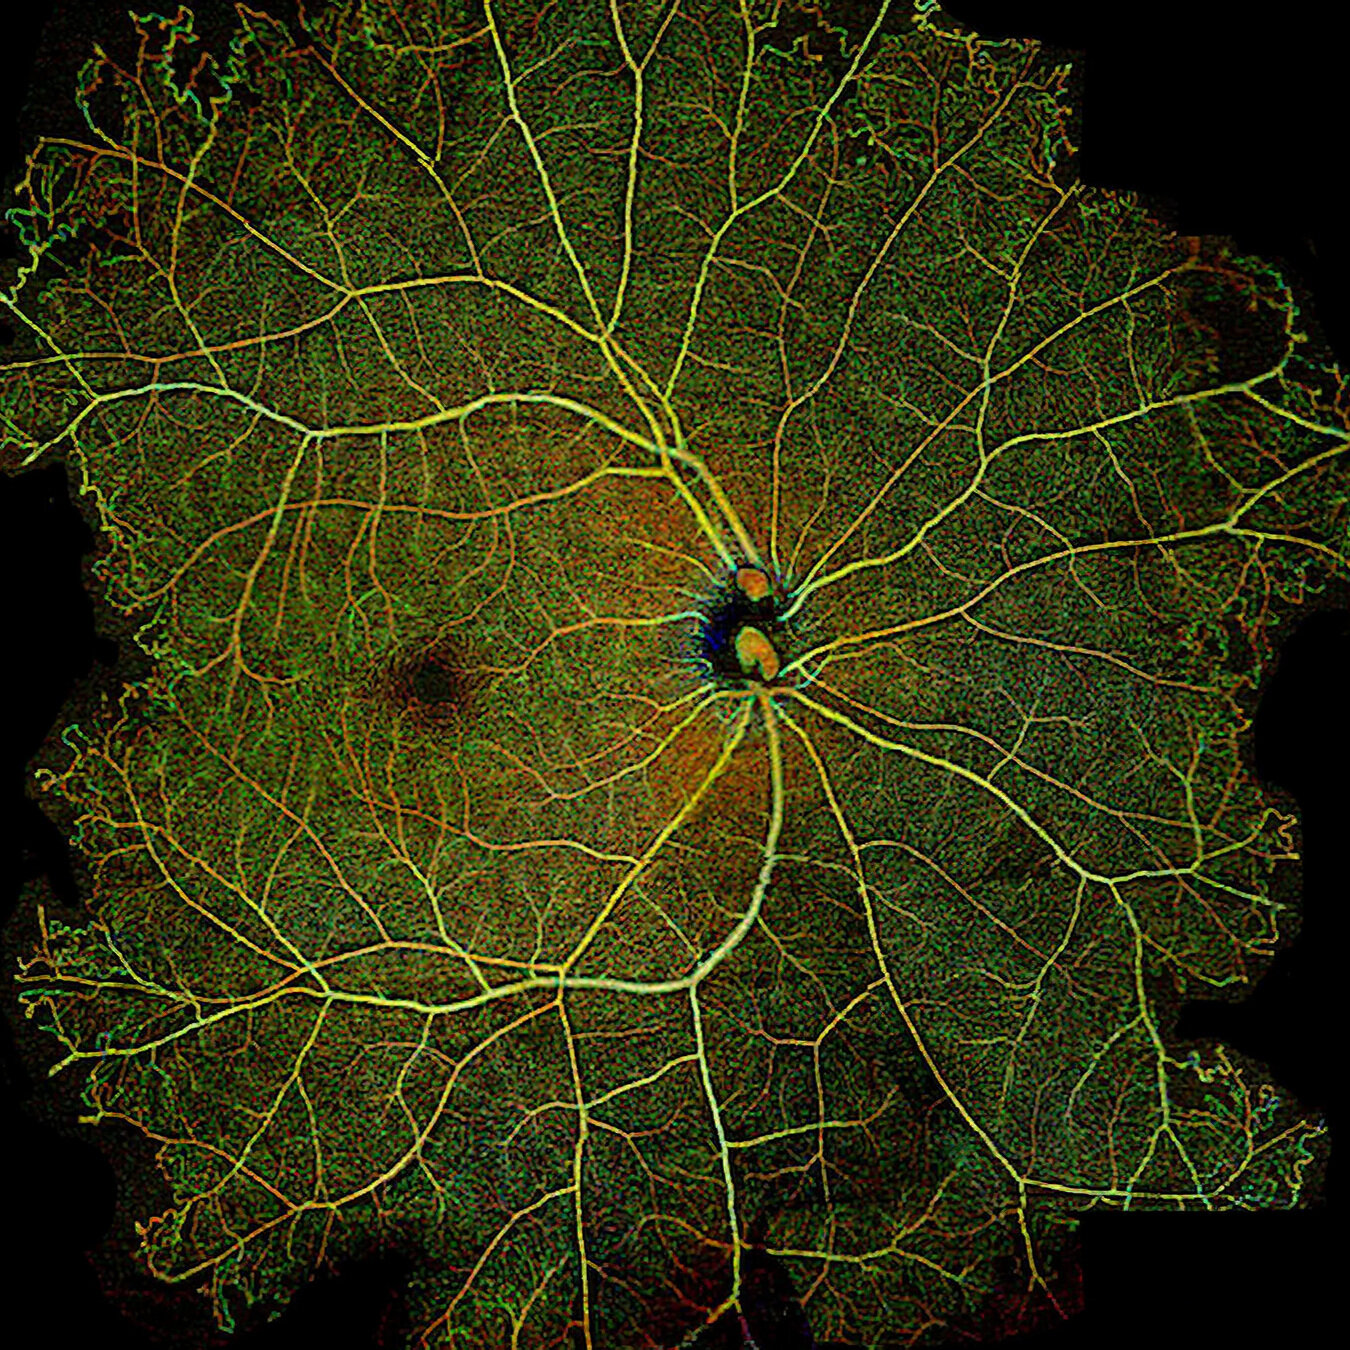
Colorized OCT-A image (via Zeiss PlexElite)
Retinal function can be assessed using functional electroretinography (fERG). This assessment stimulates the photoreceptors and ganglion cells and measures the cells’ electrical response and amplitude (image to the right). Different waves (A and B-wave shown on the right) correspond to different cell responses, and through this, we can understand how well retinal cells are working. We can also investigate whether there are specific structural and vascular changes that are associated with changes in retinal function.
Currently, we are investigating retinal functional, structural, and vascular changes in early-course schizophrenia and encompasses the following:Retinal OCT/OCT-A scansBrain MRIContrast-enhanced MRIBlood collectionClinical/neuropsychological assessments